Getting around CoreScope
Guide · web UI only · updated June 2026
CoreScope is the live MeshCore analyzer we host — a map, a packet feed, and per-node stats, all in the browser. Here’s what each view does and how to drive it.
The lay of the land
Open CoreScope — no login, nothing to install. The top bar switches between the main views:
- Live — the animated trace map.
- Packets — the real-time packet feed (and the filter language).
- Nodes — the directory and per-node analytics.
- Channels — decoded group chat.
- Analytics — mesh-wide charts.
- Observers — the stations feeding the data.
Two things worth knowing up front: nearly every view has a shareable URL (copy the address bar to send someone the exact view), and Ctrl+K opens a global search across packets, nodes and channels.
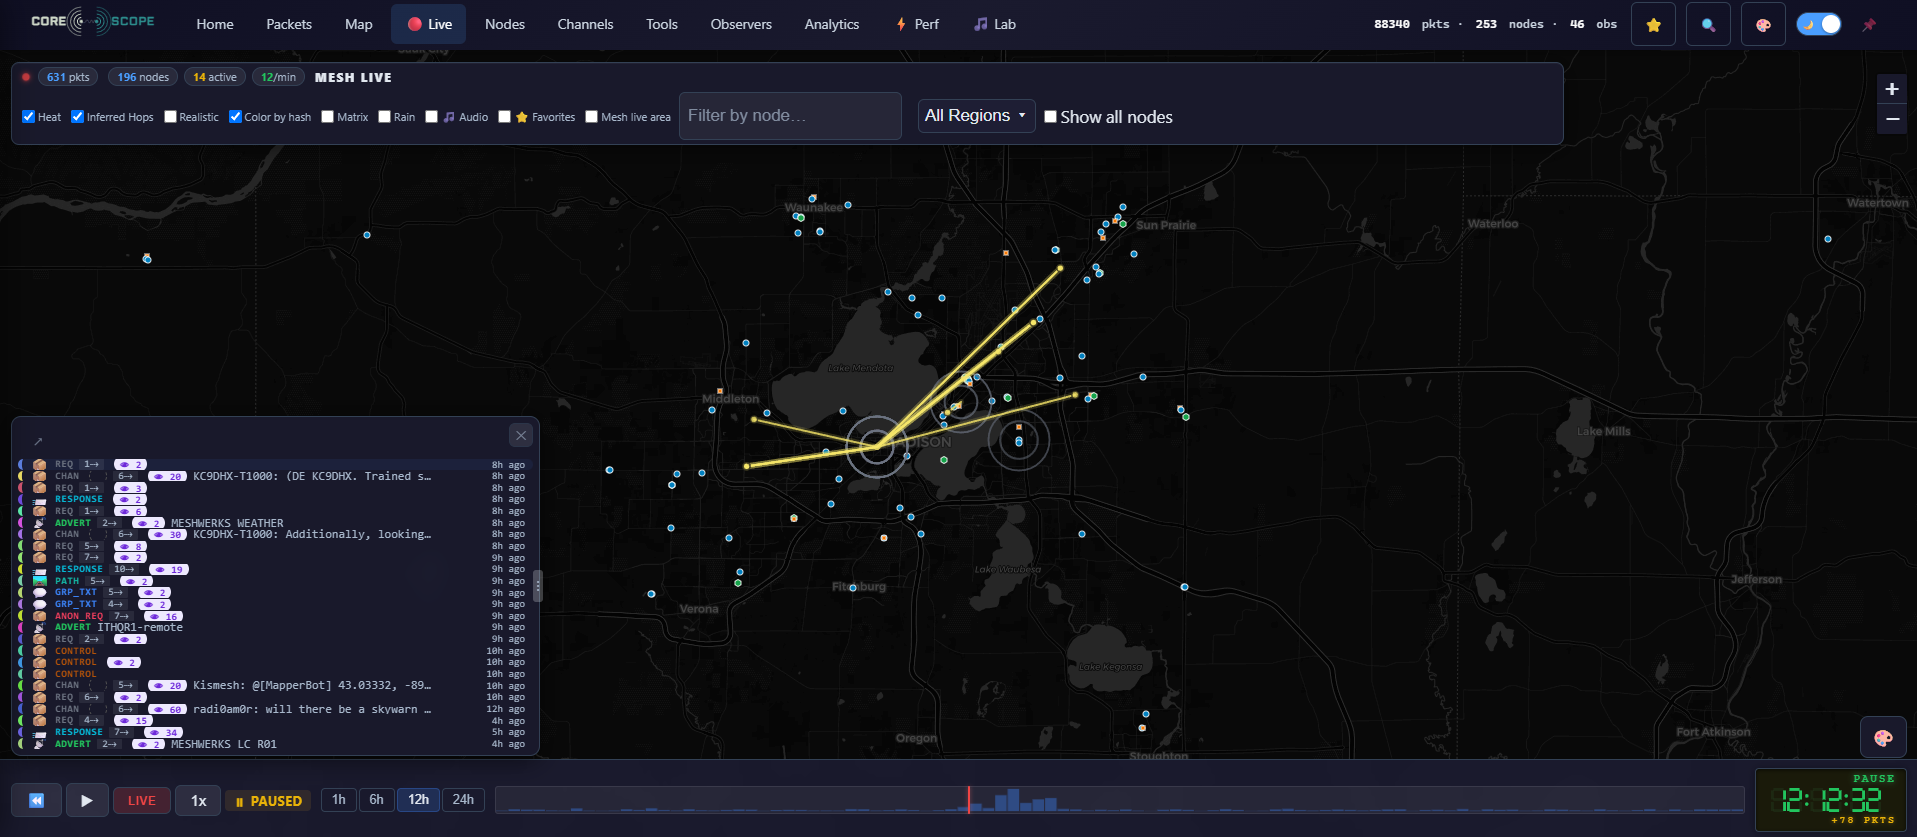
The live trace map
The headline view: nodes on a map with packets animating along the paths they actually travelled. The control bar works like a VCR — play live, or scrub back through the last 24 hours and replay the mesh at up to 4× speed. The retro clock shows the moment you’re watching.
Toggle My Nodes to spotlight your own gear, and click any node or link to drill in.
The packet feed
A live, scrolling table of every packet as it’s heard. Columns are resizable (drag the dividers), and clicking a row opens a detail pane with a byte-level breakdown of the packet. Toggle My Nodes to focus on your mesh.
Up top sit the filters: quick Hash and Node name boxes for fast lookups, and the powerful expression box beside them. That filter language — fields, operators, recipes — has its own guide:

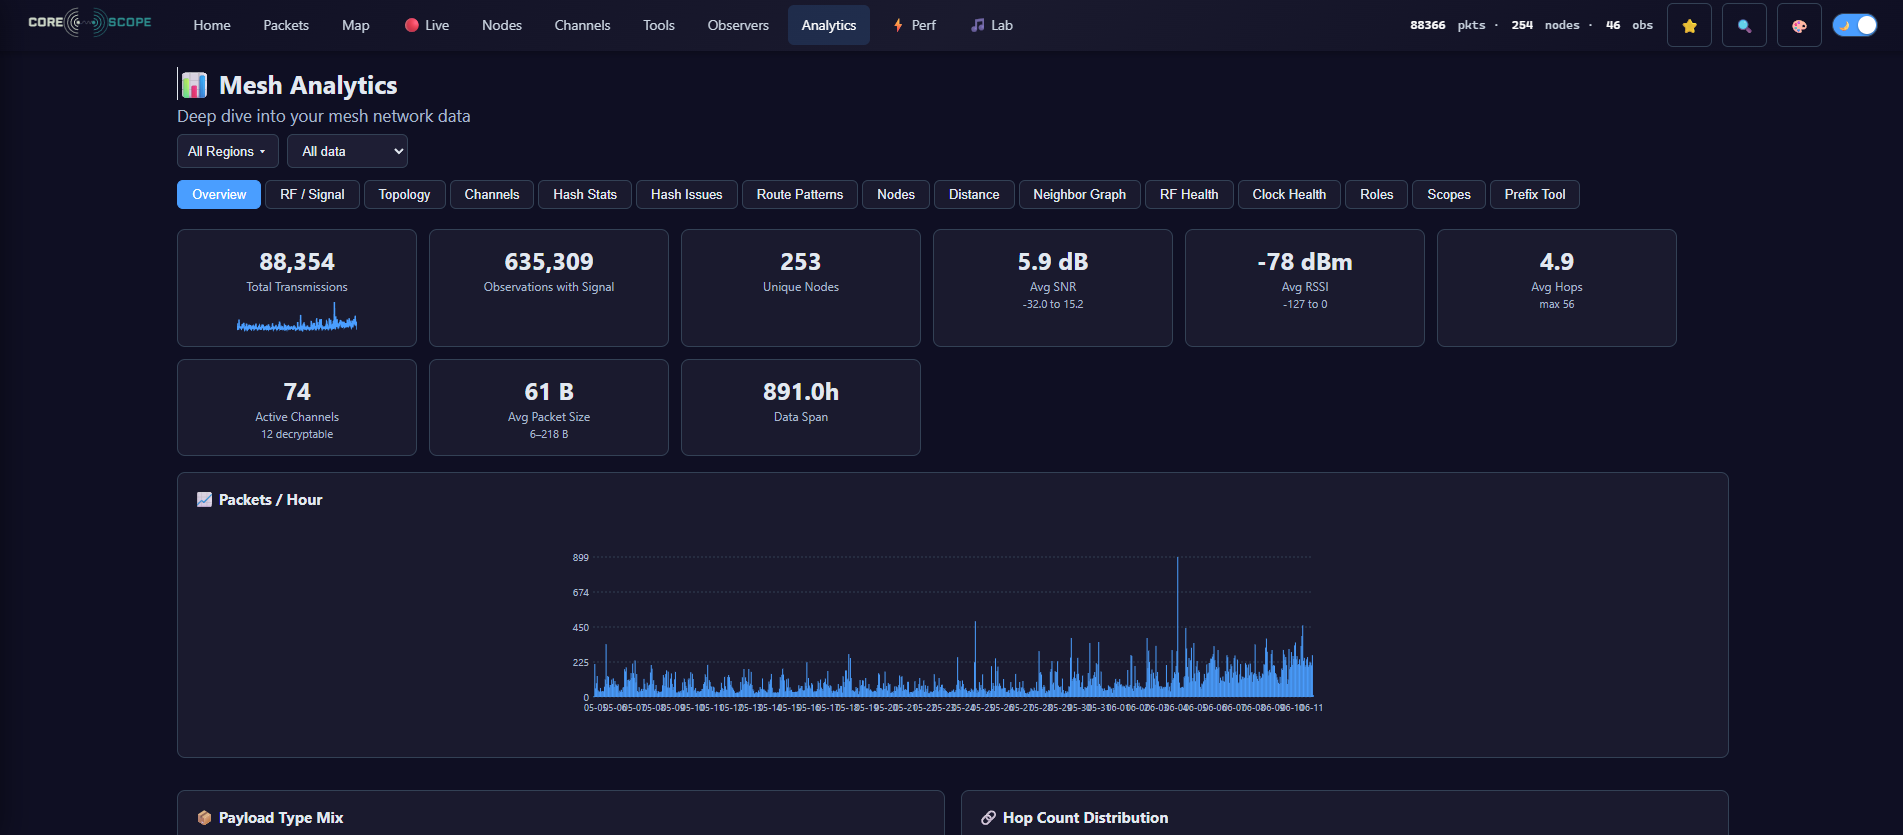
Network overview
The at-a-glance dashboard: how many nodes are out there, how much traffic is flowing, and how well the observers are covering the area. A good first stop to gauge whether the mesh is healthy and busy.
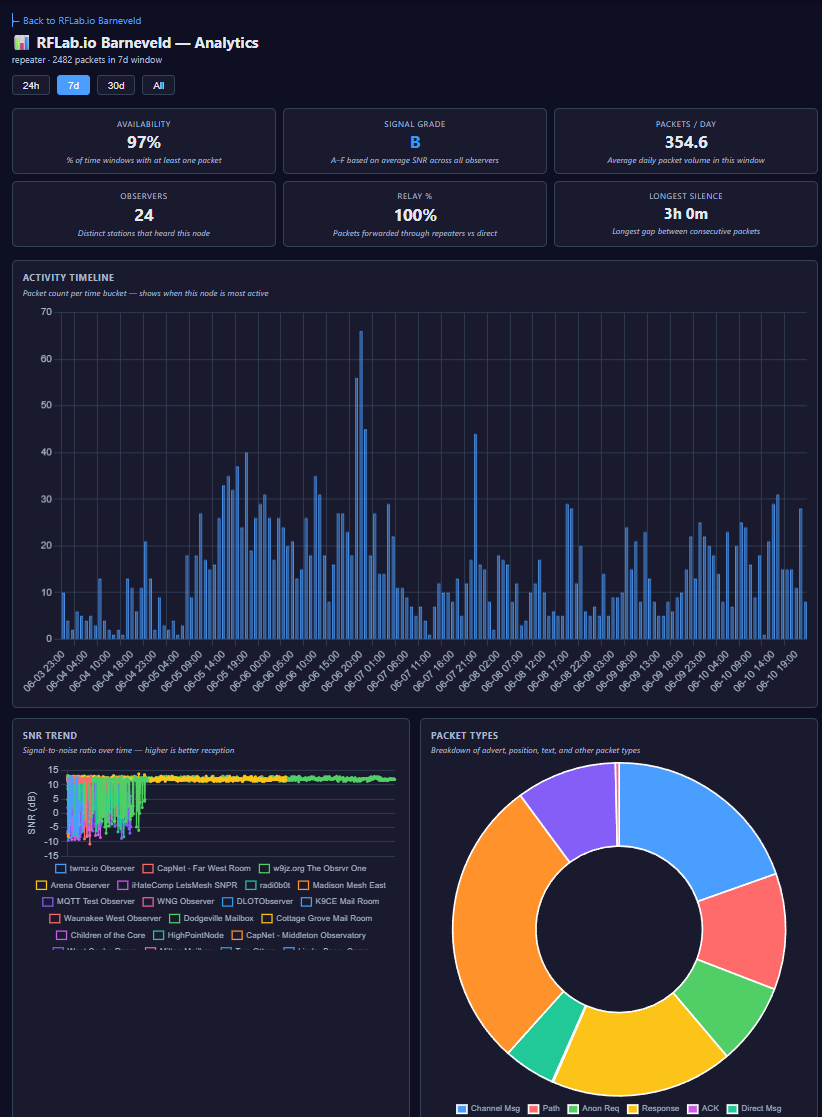
Nodes & analytics
A searchable directory of every node the mesh has seen, with tabs for each role (companion, repeater, room server). Open one and you get a deep per-node panel: an activity timeline, a packet-type breakdown, SNR and hop-count distributions, a peer graph, an hourly heatmap, its advert history, and a QR code for sharing the node.
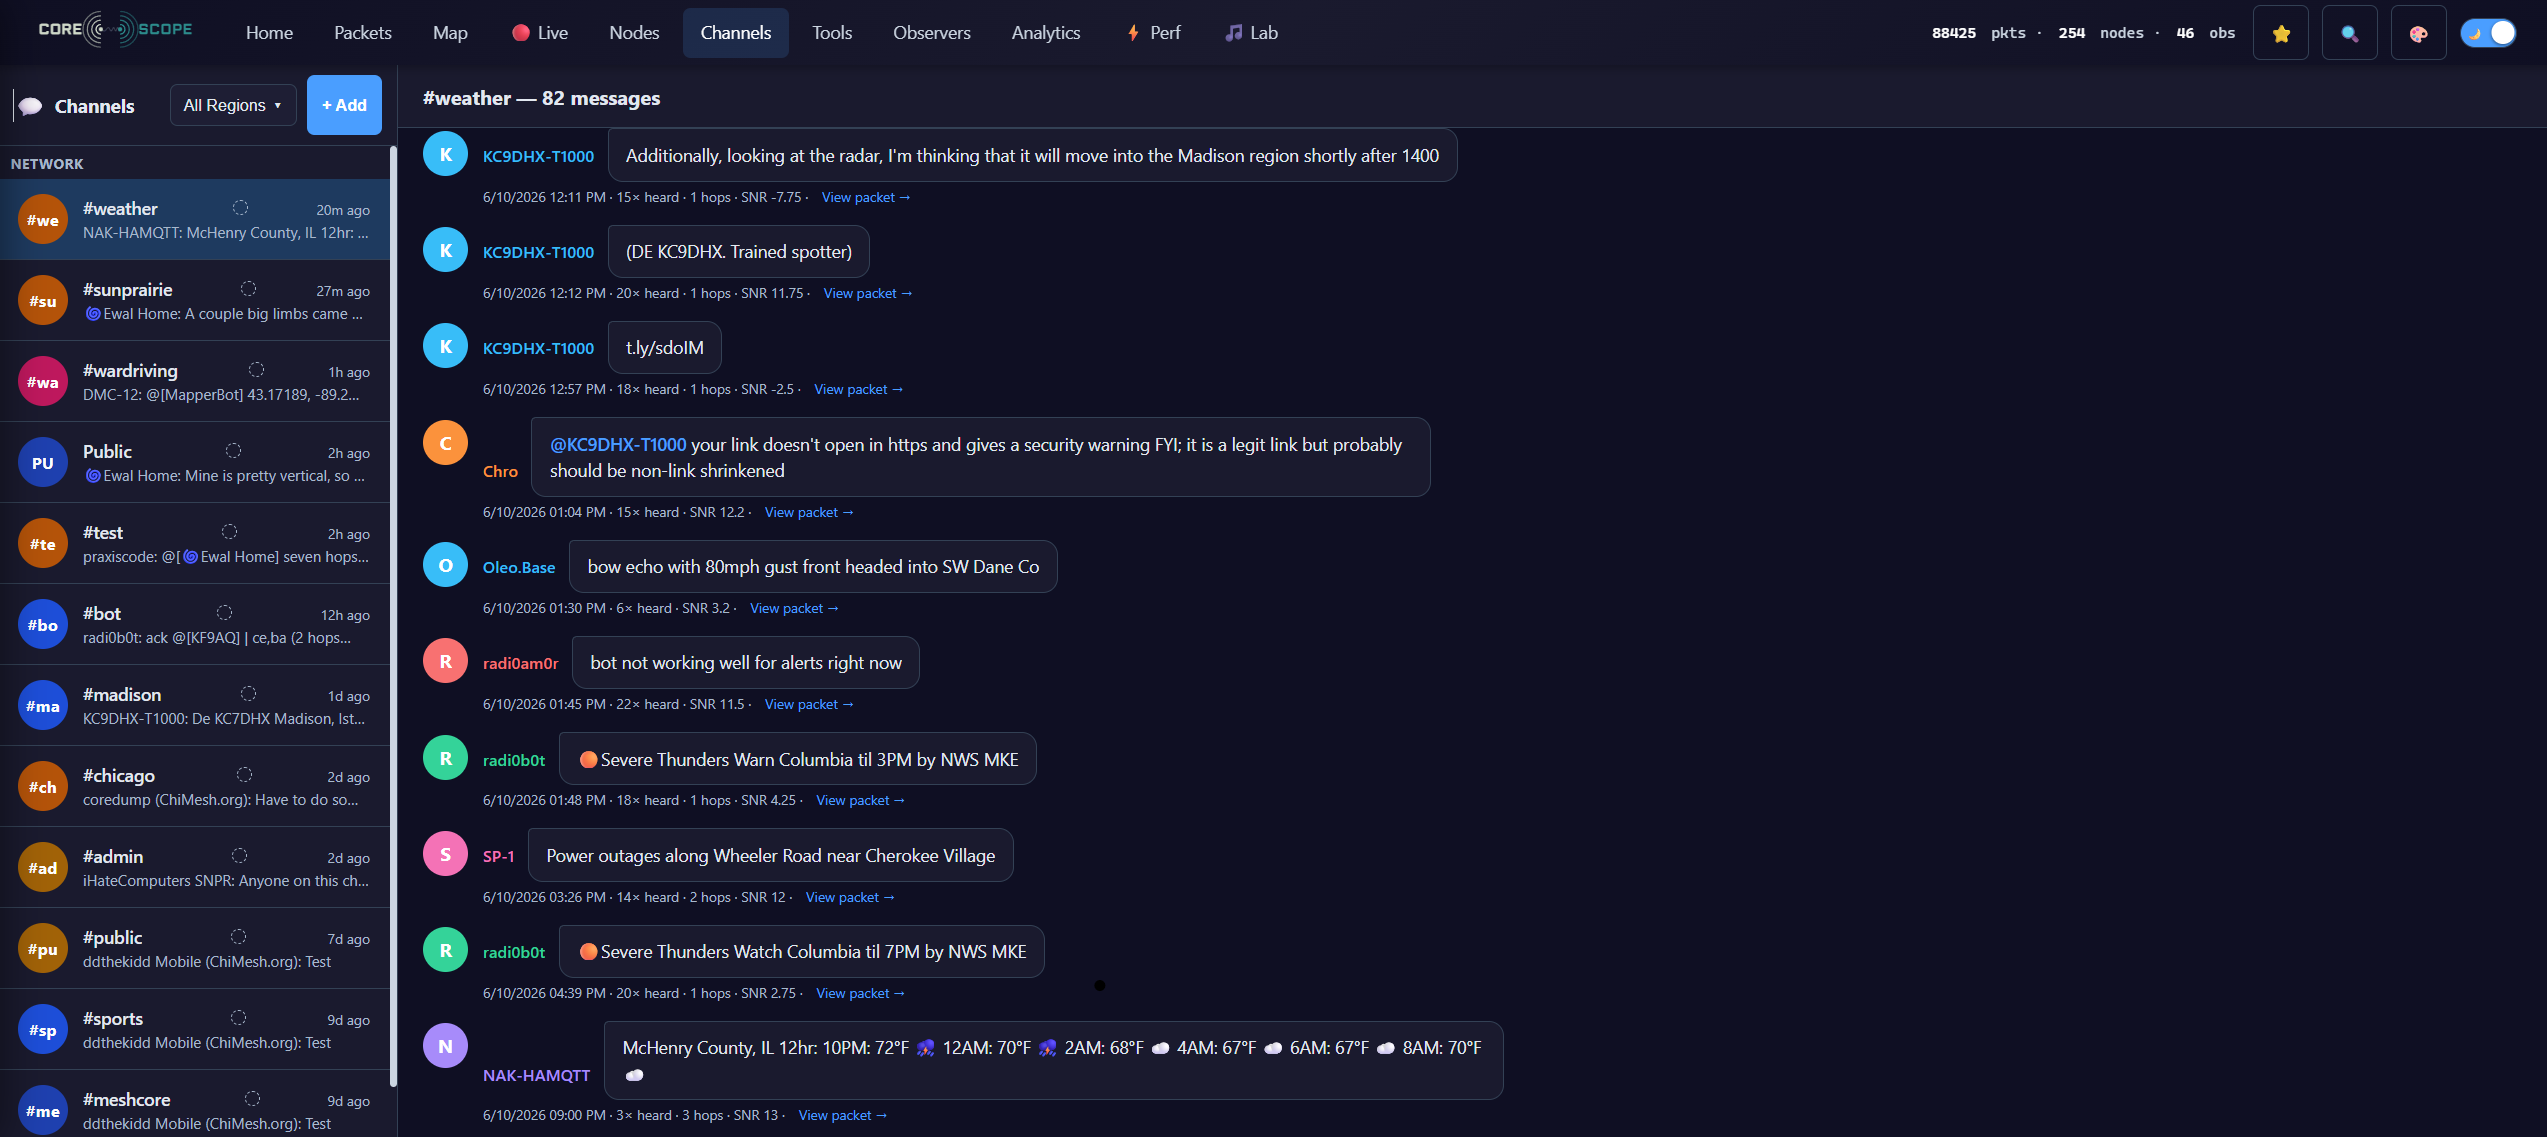
Channels
Decoded group messages laid out like a chat app — sender names, timestamps and @mentions, for any channel CoreScope has the key to. The fastest way to see what’s actually being said on the mesh.
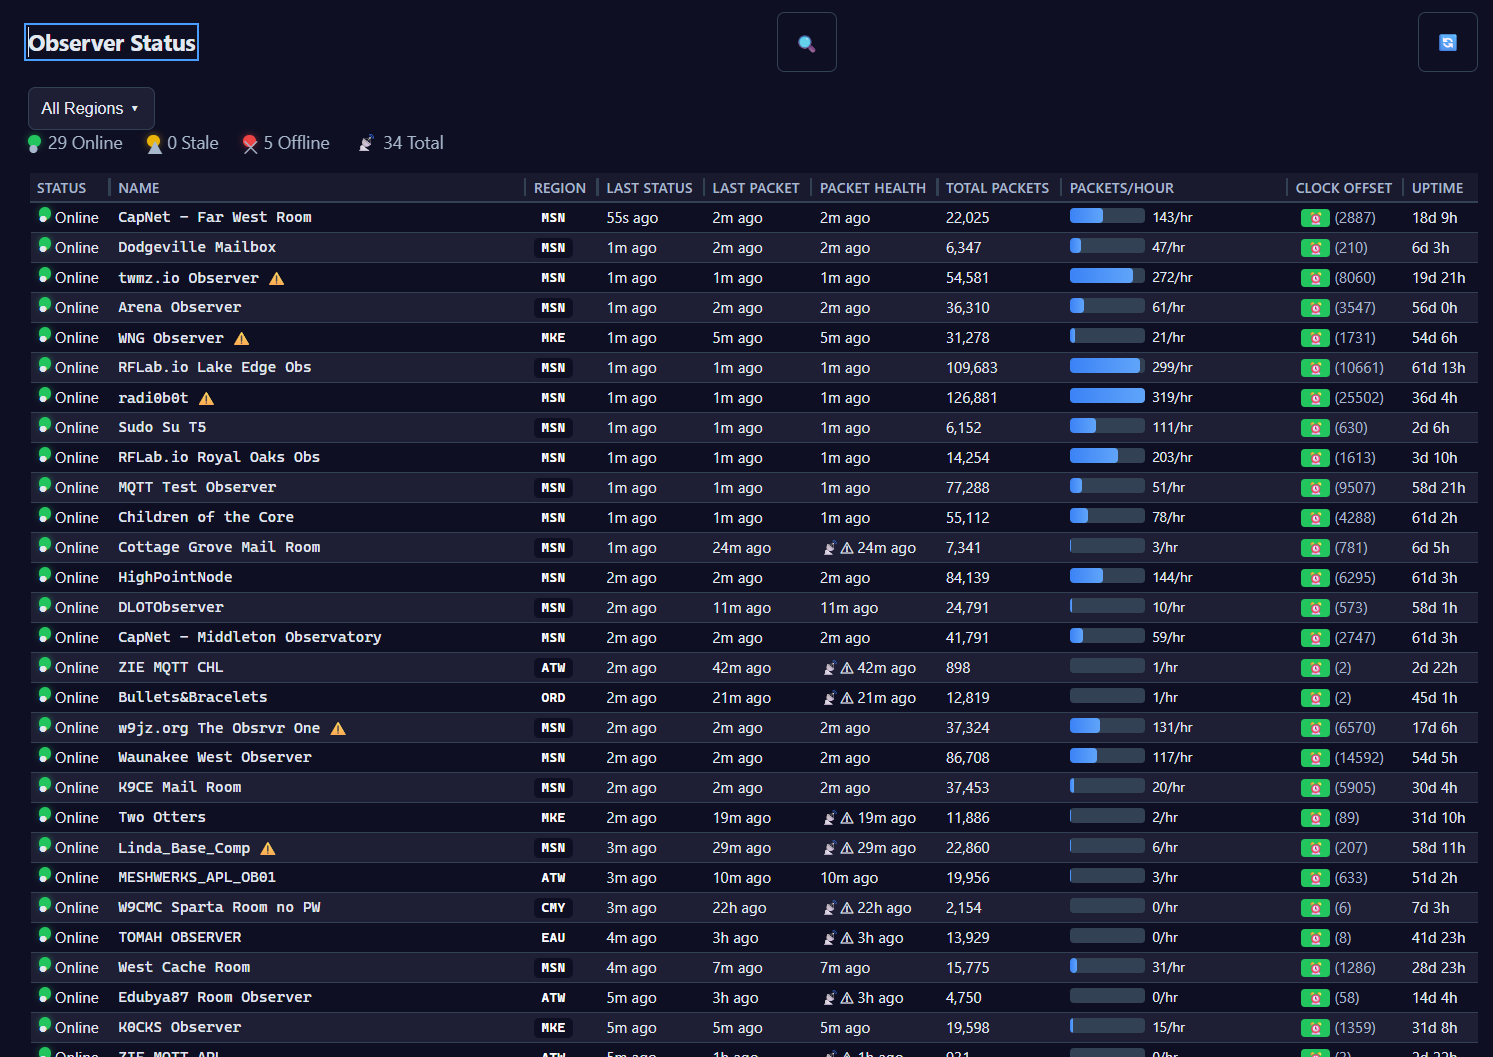
Observers
The stations that actually hear the packets and feed CoreScope. This view shows each one’s health, packet counts, uptime and region (IATA) code — useful for understanding why coverage looks the way it does, and for spotting an observer that’s gone quiet.
Want to add your own node to the feed? See the observer firmware guide.
Small things that help
- Global search — Ctrl+K jumps to any packet, node or channel.
- Shareable links — most views encode their state in the URL, so a copied address reopens exactly what you were looking at (filters included).
- Dark / light — follows your system theme; the map tiles swap to match.
- Mobile — the whole thing works on a phone, with touch controls and a compact playback bar.
Watching the mesh together
Spot something odd on the map? Bring it to #meshcore.